Sep 24, 2026
Choosing between behind-the-meter battery storage for homes, front-of-the-meter utility-scale energy storage, and a commercial Energy Storage System ROI calculation is not simply a matter of selecting a larger battery. A factory concerned about demand charges needs a different design from a utility balancing solar output. The decision also depends on peak shaving, ancillary services, the point of common coupling, round-trip efficiency, and the capabilities of the battery energy management system. This guide compares the two architectures by technical parameters, application, cost, risk, customer experience, and practical purchasing steps.

The dividing line is the utility meter. A behind-the-meter, or BTM, energy storage system is installed on the customer side of the utility meter. It can store electricity from the grid or on-site solar, then discharge it to reduce grid purchases, support backup loads, or lower a commercial facility’s monthly peak demand.
A front-of-the-meter, or FTM, energy storage system is connected on the utility or independent power producer side of the meter. Its job is usually to provide grid-scale services such as frequency regulation, renewable energy shifting, capacity support, congestion relief, and energy arbitrage. Instead of reducing one customer’s electricity bill, it participates in wholesale markets or supports a distribution or transmission network.
This distinction creates different design priorities. A BTM project is normally evaluated through electricity-bill savings, resilience, solar self-consumption, and demand-charge reduction. An FTM project is assessed through revenue stacking, interconnection capacity, market rules, availability guarantees, degradation modeling, and the value of delivered megawatt-hours.
Consider a commercial building with a 500 kW monthly demand peak that lasts only 15 minutes. If the utility charges approximately $18 per kW for demand, one unmanaged peak can create a monthly demand charge of about $9,000. A properly controlled 250 kW battery may reduce the recorded peak to 250 kW, producing a theoretical demand-charge reduction of approximately $4,500 for that billing period, before efficiency losses, software fees, and battery degradation are considered.
Residential BTM systems solve a different problem. A 13.5 kWh battery paired with rooftop solar may store midday solar generation and discharge during evening loads. If a household uses 20 kWh between 5 p.m. and 10 p.m., the battery may cover part of that demand, although usable capacity, inverter output, reserve settings, and state-of-charge limits determine the actual result.
FTM systems are commonly rated in megawatts and megawatt-hours. A 100 MW/400 MWh project has a nominal four-hour duration. It can charge when solar or wind generation is abundant and discharge during evening demand. In a frequency-regulation application, the same asset may move up and down rapidly around a target operating point rather than discharge continuously for four hours.
The financial model is therefore more complex. A utility-scale battery may earn revenue from energy arbitrage, capacity payments, frequency regulation, spinning reserve, black-start support, and renewable integration. However, those revenue streams depend on market access, bidding rules, transmission constraints, interconnection status, and the battery’s remaining usable capacity.
The following comparison uses typical lithium iron phosphate, or LFP, project ranges. Actual values vary by supplier, ambient temperature, operating window, warranty conditions, grid code, and installation design.
| Parameter | Behind-the-Meter Energy Storage | Front-of-the-Meter Energy Storage |
|---|---|---|
| Primary owner | Homeowner, commercial customer, campus, factory, or building operator | Utility, independent power producer, energy retailer, or infrastructure fund |
| Electrical position | Customer side of the utility meter | Utility, transmission, or distribution side of the meter |
| Typical project size | 5–50 kWh for homes; 100 kWh–20 MWh for commercial and industrial sites | 10–500+ MW, generally 20–2,000+ MWh |
| Typical duration | 2–6 hours, depending on backup and tariff objectives | 1–8 hours; four-hour systems are common in solar shifting and capacity applications |
| Primary value | Bill savings, demand-charge management, backup power, and solar self-consumption | Energy arbitrage, capacity, ancillary services, renewable integration, and grid reliability |
| Typical round-trip efficiency | Approximately 85%–95% at the system level under favorable conditions | Approximately 85%–93%, depending on transformer, HVAC, auxiliary load, inverter, and dispatch profile |
| Response time | Usually milliseconds to seconds for backup and power-quality functions | Milliseconds to seconds for frequency response; scheduled dispatch may operate in five-minute or hourly intervals |
| Interconnection | Often low- or medium-voltage interconnection; utility approval still required | Medium- or high-voltage interconnection with detailed studies and protection coordination |
| Control priority | Customer load, solar generation, tariff schedule, backup reserve, and export limits | Market dispatch, grid operator instructions, state of charge, capacity obligations, and network constraints |
| Common battery chemistry | LFP for safety, cycle life, and residential or commercial availability | LFP is increasingly common; other chemistries may be selected for specific duration or performance requirements |
| Common warranty structure | Typically 10 years, with energy-retention or throughput limits | Often 10–20 years, with availability, capacity-retention, response-time, and throughput guarantees |
| Typical design challenge | Correctly matching battery power to the load profile and tariff | Securing interconnection, bankable revenue, land, permits, and long-term operational performance |
One technical detail is frequently overlooked: a battery’s energy capacity and power capacity are not interchangeable. A 1 MW/4 MWh system can discharge at 1 MW for approximately four hours under nominal conditions. A 4 MW/4 MWh system can deliver more power, but only for about one hour. Customers should request both figures, along with usable energy at the beginning and end of the warranty period.
BTM storage is usually appropriate for a homeowner who has time-of-use pricing, frequent outages, rooftop solar, export limitations, or a strong preference for energy independence. The battery can charge when solar production is high or grid electricity is inexpensive, then discharge during expensive evening periods.
It is less attractive when the household has flat electricity pricing, reliable grid service, limited solar production, and no compensation for exported energy. In that situation, the annual bill savings may not offset the installed cost over the desired payback period.
Factories, cold-storage warehouses, data centers, offices, and retail sites often benefit from BTM systems because a short demand spike can affect an entire monthly bill. The correct battery size should be based on at least 12 months of interval data, preferably at 15-minute resolution. A system selected from the facility’s average load alone may fail to control the actual billing peak.
For example, an 800 kW facility may have an average demand of 350 kW but occasional peaks above 700 kW when compressors, chillers, and production motors start together. A 300 kW battery with an appropriate power-control strategy could be more valuable than a larger energy-only system, because the economic target is peak reduction rather than long-duration backup.
Commercial users should also examine export restrictions. If the utility does not allow reverse power flow, the energy management system must control charging and discharging at the point of common coupling. Poorly configured controls can cause nuisance trips, missed demand savings, or unplanned grid exports.
FTM storage is a stronger fit for utilities and project developers managing renewable curtailment, evening ramps, capacity shortfalls, or congested transmission corridors. A solar plant may produce surplus energy at noon while the grid experiences its highest net demand after sunset. A four-hour FTM battery can shift part of that generation into the higher-value period.
However, a utility-scale project should not be justified only by a simple “buy low, sell high” calculation. The model must include degradation, auxiliary consumption, charging losses, inverter replacement, augmentation, land lease, property tax, insurance, interconnection upgrades, market fees, and periods when the system is unavailable.
Installed prices vary widely by country and project conditions. As a broad 2024–2025 planning range in the United States, residential BTM systems may fall around $800–$1,500 per usable kWh installed, commercial systems around $500–$1,000 per kWh, and utility-scale four-hour systems around $200–$400 per kWh at the battery-and-system level. These figures are not universal quotations and may exclude interconnection, development, financing, taxes, land, transmission upgrades, and augmentation.
| Cost item | BTM project effect | FTM project effect |
|---|---|---|
| Battery modules | Often a large share of residential and small commercial cost | Lower unit pricing may be achieved through large-volume procurement |
| Inverter and power conversion system | Must match customer voltage, backup loads, and export rules | Must meet grid-code, fault-current, reactive-power, and dispatch requirements |
| Installation and labor | Can be high per kWh because projects are small and site-specific | Lower per kWh at scale, but civil works and high-voltage equipment add substantial cost |
| Software and controls | Tariff optimization, demand management, solar forecasting, and backup control | SCADA, market bidding, dispatch optimization, forecasting, and grid operator integration |
| Interconnection | Usually simpler, although local transformer and feeder limits can matter | May require transmission studies, protection upgrades, network reinforcement, and long approval periods |
| Revenue certainty | Can be estimated from tariffs and load data, but utility rates may change | May depend on volatile wholesale markets and contracted capacity or ancillary-service revenue |
A useful BTM calculation is:
Annual net benefit = demand-charge savings + energy-arbitrage savings + avoided outage cost + export-value improvement − operating cost − financing cost − degradation cost.
Suppose a commercial customer invests $300,000 in a battery and expects $72,000 in annual gross savings. If annual software, maintenance, insurance, and degradation-related costs total $18,000, the simple payback is approximately:
$300,000 ÷ ($72,000 − $18,000) = 5.6 years.
This is only a screening calculation. A discounted cash-flow model should include battery replacement or augmentation, inflation, tax treatment, incentives, financing interest, and the probability that the utility changes its tariff.
For FTM projects, the equivalent calculation is based on net present value, internal rate of return, levelized cost of storage, and contracted or merchant revenue. A project with a low battery price can still produce a weak return if interconnection costs rise or market prices compress after several competing batteries enter the same node.
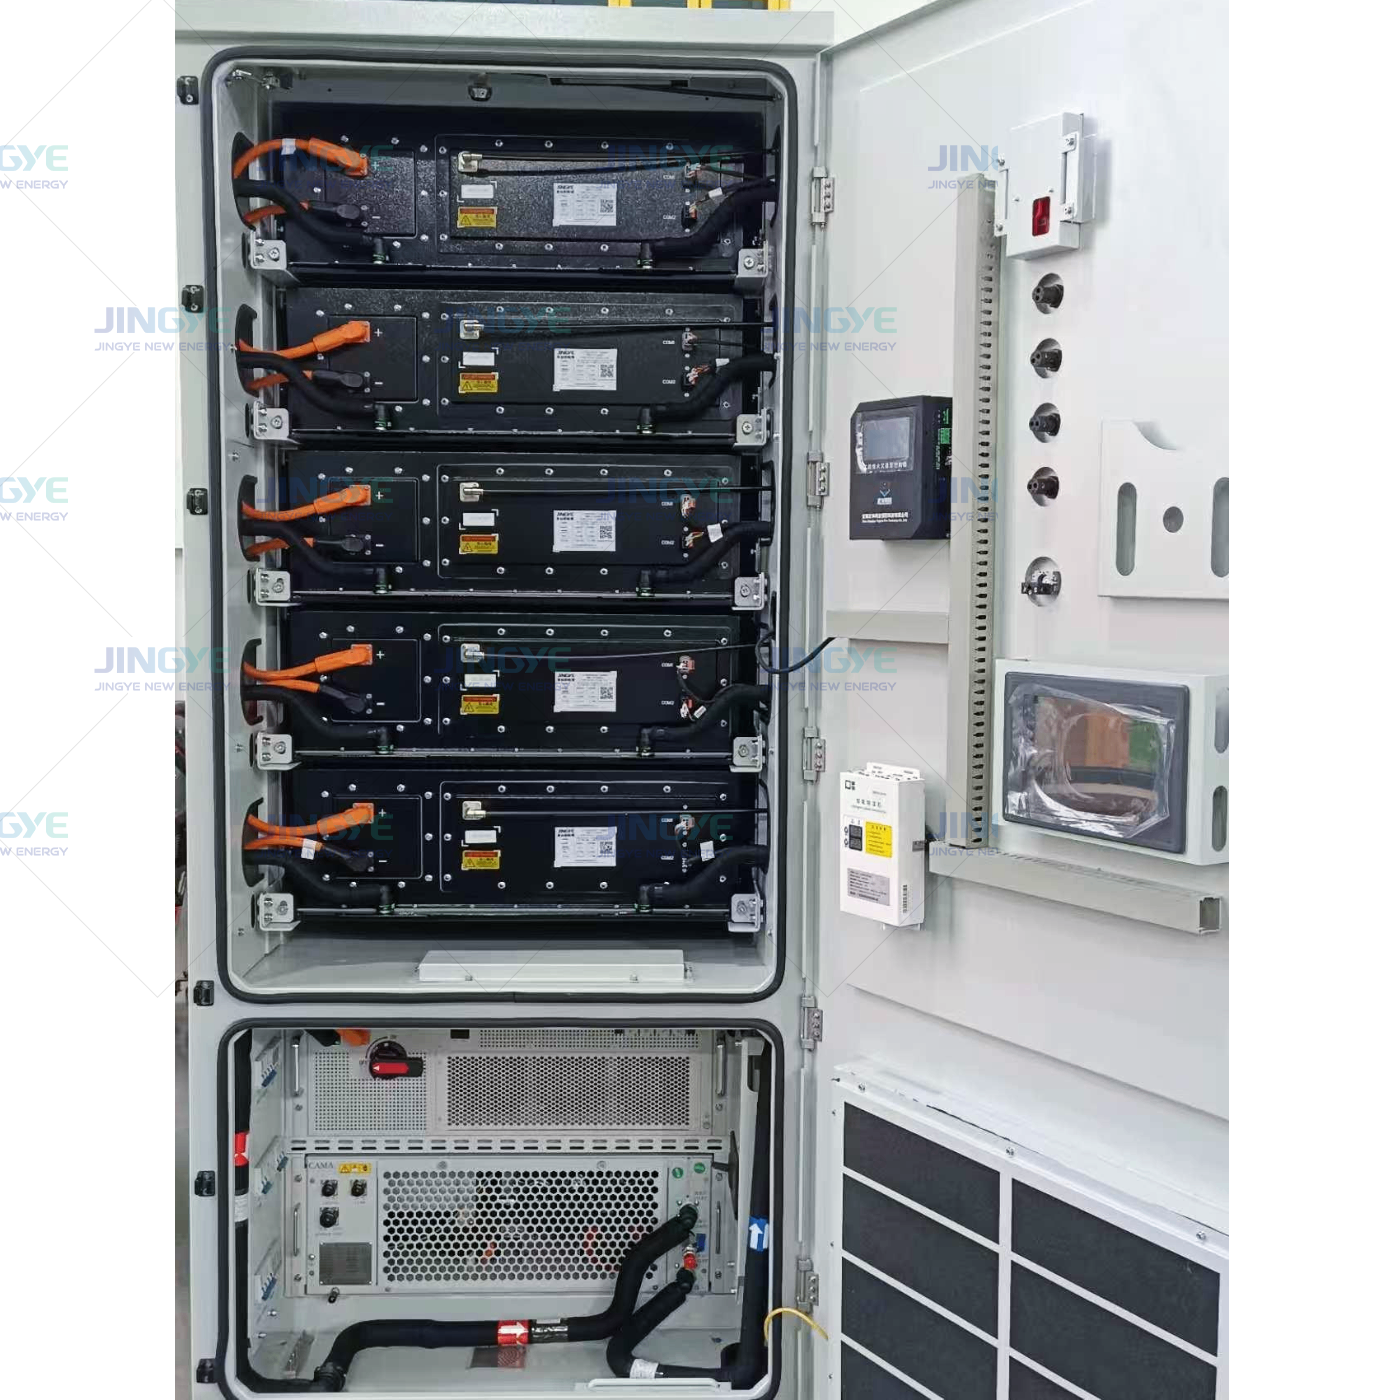
Both architectures require more than a battery container. A complete system normally includes battery management systems, power conversion systems, thermal management, fire detection, emergency shutdown, communications, protection equipment, and an energy management system.
LFP chemistry is widely selected because its thermal stability is generally better than that of nickel-manganese-cobalt chemistries under comparable conditions. It is not risk-free. Thermal runaway prevention still depends on cell quality, mechanical design, electrical protection, ventilation, spacing, temperature monitoring, and commissioning. Buyers should ask for applicable certification, fire-testing documentation, emergency-response procedures, and local code compliance rather than relying on chemistry labels alone.
Degradation is normally expressed through capacity retention and equivalent full cycles. If a battery begins with 100 kWh of usable capacity and the warranty guarantees 80% retention after a defined period or throughput, the customer should model only 80 kWh of end-of-life usable capacity for long-term economics. Calendar aging, high temperature, high state of charge, deep cycling, and high C-rate operation can all accelerate capacity loss.
A residential customer may cycle once per day, producing roughly 365 equivalent full cycles per year. A grid battery participating in several services may accumulate substantially more throughput, even when its state of charge moves only within a narrow range. The warranty must therefore specify both time and throughput limits.
Customer feedback tends to differ by application. Residential users commonly value silent operation, outage continuity, simple monitoring, and predictable savings. Commercial customers focus more on whether the system actually captures the site’s billing peak and whether the controls respond without disrupting production. Utility operators pay closer attention to availability, dispatch accuracy, maintenance response, and the quality of performance data.
“Our main expectation was backup power, but the first financial benefit came from storing solar during the day and reducing evening purchases. The installer had to change the reserve setting because keeping 30% of the battery for outages reduced our daily savings more than we expected.”
— Anonymized residential customer interview from a solar-plus-storage installation review
This experience illustrates a common trade-off: resilience has an opportunity cost. A battery reserved at 50% state of charge may provide stronger outage protection, but only half of its nominal energy is available for routine tariff optimization.
“The project looked attractive from the monthly demand-charge estimate. After installation, the important work was tuning the controls around our compressor start-up schedule. The battery became useful only after the system used 15-minute meter data rather than a simple daily load average.”
— Anonymized food-processing facility manager account
For a supplier such as Jingye, the practical evaluation should therefore extend beyond module specifications. Ask for commissioning procedures, remote monitoring examples, response-time commitments, spare-parts availability, warranty claim procedures, and references from sites with similar load profiles. The strongest customer experience usually comes from accurate site modeling and responsive controls, not from the largest nameplate capacity.
Storage may not be appropriate when the customer has low electricity-price volatility, no meaningful demand charge, limited solar availability, minimal outage cost, or insufficient space and interconnection capacity. Energy efficiency, load scheduling, a backup generator, grid-service contracts, or a transformer upgrade may provide a better return.
A fair supplier comparison should rank proposals using the same usable kWh, AC power rating, warranty throughput, round-trip efficiency, installation scope, degradation assumption, and operating temperature. Comparing one supplier’s DC battery capacity with another supplier’s AC usable capacity can make an inexpensive system appear stronger than it is.
Jingye should be evaluated alongside other qualified suppliers using measurable criteria rather than brand familiarity alone. Request the following information:
Jingye may be a practical candidate when its system architecture, warranty, controls, and service coverage match the site’s requirements. It should not be selected solely because of a lower quoted price. Conversely, a higher-priced proposal is not automatically better unless it produces measurable gains in availability, usable energy, safety compliance, or lifetime operating cost.
Behind-the-meter storage is generally suitable for homeowners, commercial buildings, factories, campuses, and farms that can directly capture bill savings, demand-charge reductions, solar self-consumption, or outage protection. It is less suitable for customers with flat tariffs and little operational flexibility.
Front-of-the-meter storage is generally suitable for utilities, grid developers, renewable-energy owners, and investors with access to wholesale markets or contracted grid-service revenue. It is not suitable for a small customer seeking a simple backup solution, because interconnection, market participation, permitting, and operational requirements can be disproportionate.
The next step is to collect your electricity bills, 15-minute interval data, solar production profile, outage history, tariff schedule, available installation area, and required backup loads. Then compare at least three proposals using usable AC capacity, power rating, total installed cost, guaranteed retention, round-trip efficiency, safety documentation, and a 10-year cash-flow model. Whether the final decision favors a behind-the-meter energy storage system or a front-of-the-meter utility battery, the strongest choice is the one whose measured operating benefits remain credible after losses, degradation, maintenance, and market uncertainty are included.
Sep. 28, 2026
C&I Battery Storage Capacity vs Power Rating: What Is the Difference?
Energy Storage Cabinets are increasingly used by commercial and industrial buyers to reduce peak demand, support critical loads, improve solar self-consumption, and provide backup power. However, many purchasing teams compare systems by price or cabinet size before understanding the two specifications that determine performance: battery storage capacity, measured in kilowatt-hours (kWh), and
Sep. 28, 2026
How Commercial Energy Storage Helps Reduce Demand Charges
If your electricity bill is rising because of short, high-power peaks, we can solve the problem in a simple sequence: review 12 months of interval data, identify the tariff’s demand-charge window, size Energy Storage Cabinets for the target peak, and configure an automated energy management system to discharge before the peak is billed. This step-by-step approach helps businesses reduce
Sep. 25, 2026
400V vs 800V EV Charging: Key Differences for Modern Electric Vehicles
Choosing between a 400 V and an 800 V electric vehicle is no longer only an engineering decision. It affects charging time, highway convenience, battery design, purchase price, charging site requirements, operating cost, and long-term reliability. For drivers, fleet managers, charging operators, and vehicle manufacturers comparing a DC Fast EV Charger Manufacturer, the most useful answer is not
Let’s Get Started on Your New Energy Journey.