Nov 02, 2026
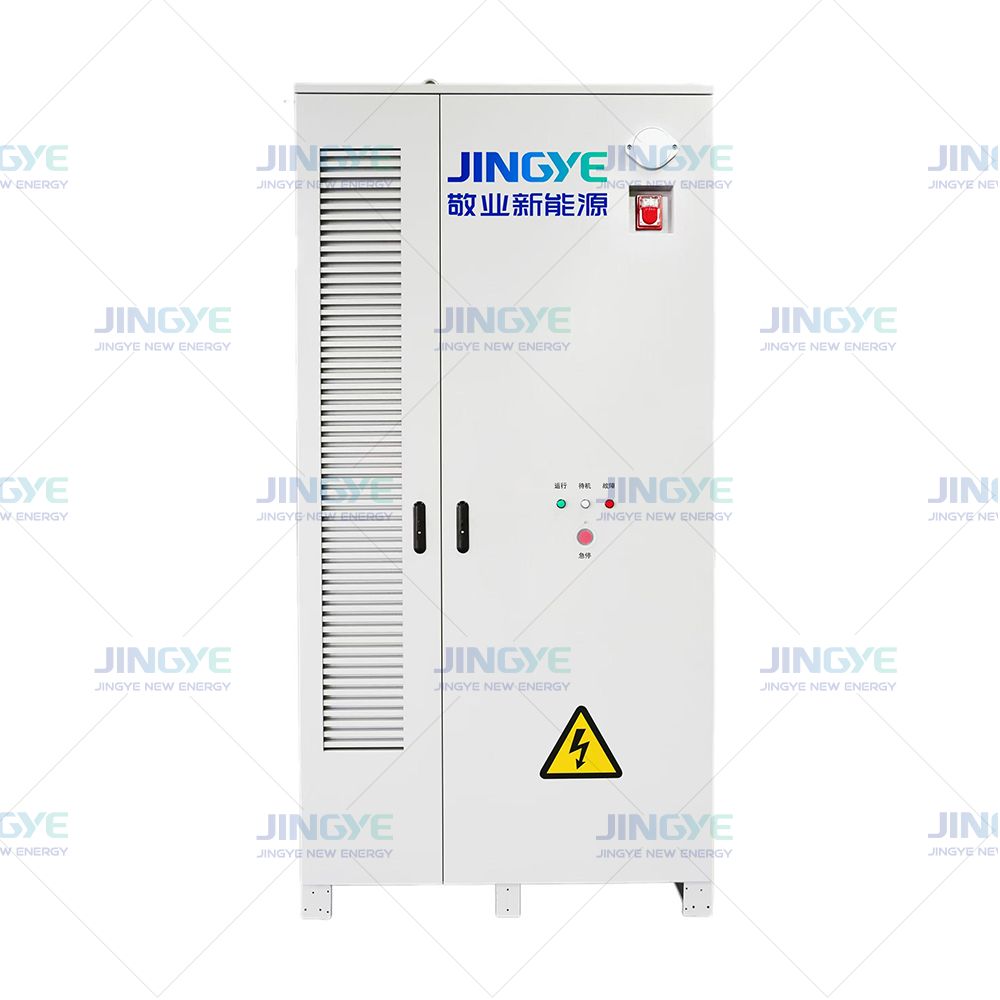
Battery depth of discharge has a direct effect on energy storage life, safety, and operating cost. Thermal management helps control heat during charging and discharging. A commercial battery storage system may lose capacity faster when it operates at high discharge levels every day. Battery cycle life also depends on temperature, charging speed, operating voltage, and rest time. The battery management system records state of charge, current, voltage, and temperature during each cycle. Understanding these factors helps users select the right Energy Storage Cabinets and set a practical operating range.
Battery depth of discharge is the percentage of a battery's usable capacity that is removed during a discharge cycle. A higher depth of discharge usually provides more energy per cycle, but it can increase battery degradation and reduce energy storage life. For many lithium iron phosphate battery systems, a daily operating range of 10 percent to 90 percent state of charge, equal to 80 percent DoD, provides a useful balance between capacity and service life. The exact limit should follow the battery manufacturer's warranty, test data, temperature limits, and battery management system settings.
Battery depth of discharge, or DoD, shows how much stored energy has been used. State of charge, or SoC, shows how much energy remains.
| Starting SoC | Ending SoC | Depth of Discharge | Energy Used From a 100 kWh Battery |
|---|---|---|---|
| 100 percent | 90 percent | 10 percent | 10 kWh |
| 100 percent | 80 percent | 20 percent | 20 kWh |
| 100 percent | 50 percent | 50 percent | 50 kWh |
| 100 percent | 20 percent | 80 percent | 80 kWh |
| 100 percent | 0 percent | 100 percent | 100 kWh |
The usable energy in an energy storage cabinet is lower than the nameplate rating after system limits and conversion losses are considered. For example, a 100 kWh cabinet operated at 80 percent DoD has a theoretical discharge amount of 80 kWh. If the power conversion system and other equipment produce 92 percent round-trip efficiency, the energy returned after a full charge and discharge is lower than the energy sent into the system.
A full equivalent cycle means the battery has discharged an amount equal to 100 percent of its rated capacity. Two 50 percent discharges normally equal one full equivalent cycle. Four 25 percent discharges also equal one full equivalent cycle.
This method is useful for energy storage life calculations. It also explains why a cabinet can perform several daily operations without completing a full equivalent cycle each day.
During discharge, lithium ions move between the positive and negative electrodes. A deeper discharge moves more ions and causes a wider change in electrode conditions. Repeating this process can increase loss of active material, growth of the solid electrolyte interphase layer, and cell resistance.
High current can increase this effect. A battery discharged at 1C provides its rated capacity in about one hour. A battery discharged at 0.5C provides the same capacity in about two hours. Lower current usually produces less heat and lower stress, although the final result still depends on cell design and temperature.
Manufacturers often publish cycle life at a stated temperature, charge rate, discharge rate, DoD, and end-of-life capacity. A cycle life result at 25 C, 0.5C, 80 percent DoD, and 80 percent remaining capacity cannot be compared directly with a result at 45 C, 1C, 100 percent DoD, and 70 percent remaining capacity.
| Operating Condition | Expected Effect | Reason |
|---|---|---|
| 20 percent to 80 percent SoC | Lower daily stress | Moderate DoD and less time at high voltage |
| 10 percent to 90 percent SoC | Balanced use of capacity | About 80 percent DoD with an operating reserve |
| 0 percent to 100 percent SoC | Higher stress | Maximum voltage range and deeper discharge |
| Operation above 40 C | Faster degradation risk | Heat accelerates chemical aging |
| High charge or discharge current | Higher heat and voltage drop | Greater electrical and thermal load |
Lithium iron phosphate, or LFP, is widely used in energy storage cabinets because it offers stable thermal behavior, useful cycle life, and a lower risk of thermal runaway than some other lithium-ion chemistries. Many LFP products are specified for 80 percent to 100 percent DoD under controlled conditions. The actual daily setting should follow the product warranty.
For a cabinet used for solar energy storage, a 70 percent to 90 percent DoD limit may be practical when the system must provide strong daily energy output. A smaller DoD range may be better when the main goal is backup power and long standby life.
Lead acid batteries often need a lower regular DoD than LFP batteries. Frequent discharge below 50 percent DoD can shorten service life in many lead acid designs. These batteries may also require ventilation, water maintenance, and careful control of charging voltage.
Flow batteries can support deep cycling because energy is stored in liquid electrolytes. Their performance depends on pump operation, electrolyte balance, and system design. Nickel-based and sodium-based batteries have different voltage and temperature limits. Users should not apply an LFP DoD setting to another battery chemistry.
| Battery Type | Common Energy Storage Use | DoD Planning Consideration | Main Control Point |
|---|---|---|---|
| LFP lithium-ion | Commercial, industrial, and solar storage | Often 70 percent to 90 percent for daily use | SoC limits, temperature, and current |
| Lead acid | Backup and small off-grid systems | Lower regular DoD is often preferred | Charging voltage and ventilation |
| Flow battery | Long-duration grid storage | Deep cycling may be suitable | Electrolyte balance and pump operation |
Use this calculation:
Usable discharge energy = Rated battery capacity x DoD
For a 200 kWh energy storage cabinet operated at 80 percent DoD:
200 kWh x 0.80 = 160 kWh of theoretical discharge energy
If the system supplies 150 kWh to the load after conversion and auxiliary consumption, the remaining energy is used by the power conversion system, cooling equipment, controls, and other losses.
A simple lifetime estimate uses the following formula:
Lifetime energy throughput = Rated capacity x DoD x Equivalent full cycles
Example:
This is not a performance guarantee. Calendar aging, high temperature, long periods at high SoC, emergency overloads, and maintenance conditions can reduce the actual result.
A battery management system, or BMS, measures cell voltage, pack voltage, current, temperature, and SoC. It can stop charging or discharging when a limit is reached. It can also record alarms and operating history.
Cell balancing is another key function. Small voltage differences between cells can grow over time. Passive balancing removes a small amount of energy from higher-voltage cells. Active balancing transfers energy between cells. Both methods help reduce cell imbalance and protect available capacity.
Temperature has a direct effect on battery degradation and safety. Many lithium battery systems are designed to operate near 15 C to 35 C for normal performance. Charging at temperatures below 0 C can cause lithium plating in some cells. Operation above 40 C can accelerate capacity loss.
Energy storage cabinets may use air cooling, liquid cooling, or a combination of both. Liquid cooling can provide more uniform temperature control in high-power systems. The design should also control temperature differences between cells and modules. A temperature difference below 5 C is a common design target, but the required value depends on the battery supplier and cabinet design.
The power conversion system controls the direction and level of energy flow between the battery and the electrical grid. It affects charge rate, discharge rate, power factor, and grid response. A well-matched power conversion system prevents unnecessary current peaks and supports stable cabinet operation.
Project teams should identify the required standards before purchasing or installing a cabinet. Common references include IEC 62619 for industrial lithium secondary cells and batteries, UL 9540 for energy storage systems, UL 9540A for thermal runaway fire propagation testing, NFPA 855 for stationary energy storage installation, and IEC 62933 for electrical energy storage system guidance.
Local electrical, fire, building, and grid connection rules also apply. Certification to one standard does not automatically prove compliance with every local requirement.
Jingye and other energy storage cabinet suppliers may use several inspection points before shipment. A project quality plan can include the following measurable checks:
| Inspection Item | Example Acceptance Metric | Purpose |
|---|---|---|
| Cell voltage consistency | Defined spread limit at shipment, such as 30 mV | Reduce imbalance between cells |
| Insulation resistance | Test value set by the design and applicable standard | Reduce electrical shock and fault risk |
| Cooling test | Temperature difference within the project limit | Confirm thermal management performance |
| Charge and discharge test | Measured capacity and power meet the approved design | Verify usable energy |
| Communication test | All BMS, inverter, meter, and alarm signals operate | Support remote monitoring and control |
| Protection test | Overvoltage, undervoltage, overcurrent, and overtemperature alarms respond | Confirm protective functions |
Inspection records should include serial numbers, test dates, software versions, measured capacity, alarm results, and calibration information. This data supports later maintenance and warranty claims.
A solar energy storage system often charges during daylight and discharges in the evening. The controller can use a daily SoC window such as 10 percent to 90 percent. If the solar forecast is poor, it can keep a higher reserve for the next peak period.
Peak shaving systems discharge during short periods of high demand. They may use a smaller DoD on each event but operate several times per day. The design should focus on power rating, current limits, and total annual energy throughput.
Backup systems spend much of their time in standby. A higher standby SoC can help provide immediate backup, but long periods at 100 percent SoC may increase calendar aging. Some systems use a maintenance schedule that keeps the battery at a lower level until severe weather or grid risk is expected.
Grid-scale battery storage may provide frequency regulation, reserve power, energy arbitrage, or black start support. These services create different charge-discharge patterns. A dispatch controller should track both equivalent full cycles and time spent at high or low SoC.
These steps can reduce unexpected downtime. They also help operators identify battery degradation before it affects critical loads.
Battery depth of discharge is one of the main factors that controls energy storage life. A deeper discharge provides more energy from each cycle, but it can increase battery degradation when combined with high temperature, high current, and poor cell balance. For many LFP energy storage cabinets, an operating range near 10 percent to 90 percent SoC offers a practical starting point. The correct setting must still follow the battery warranty, test standards, cabinet design, and site load profile. With accurate monitoring, thermal management, cell balancing, and regular quality inspections, systems from Jingye and other qualified suppliers can deliver reliable performance for commercial, industrial, solar, and grid storage applications.
Nov. 03, 2026
Battery Energy Storage for Frequency Regulation
Battery energy storage for frequency regulation helps keep the power grid stable when electricity supply and demand change. A grid needs grid frequency control because most power systems must operate close to 50 Hz or 60 Hz. Solar power output can fall within seconds when clouds pass over a site. Wind output can also change as wind speed shifts. This creates a need for fast automatic generation
Nov. 02, 2026
Battery Depth of Discharge and Its Impact on Energy Storage Life
Battery depth of discharge has a direct effect on energy storage life, safety, and operating cost. Thermal management helps control heat during charging and discharging. A commercial battery storage system may lose capacity faster when it operates at high discharge levels every day. Battery cycle life also depends on temperature, charging speed, operating voltage, and rest time. The battery
Oct. 30, 2026
Saudi Arabia 12 GWh BESS Tender: How to Size Group 2 Bids (2026)
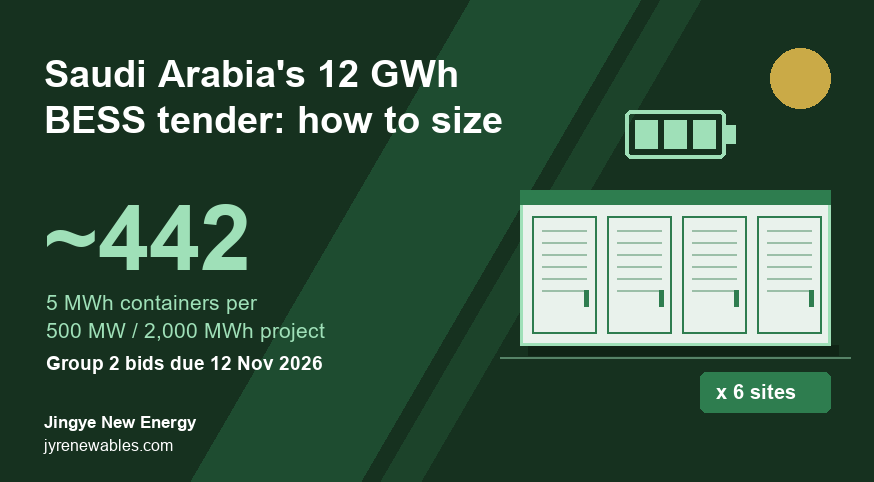
Saudi Arabia's Group 2 BESS tender (six 500 MW / 2,000 MWh sites, 12 GWh in total) now closes on 12 November 2026. By our estimate, each site needs about 442 of our 5.015 MWh containers to deliver 2,000 MWh at the grid, or up to 553 if 15-year degradation is built in upfront.
Let’s Get Started on Your New Energy Journey.